BMI Calculator
- BMI Formula: BMI = weight / height²
- BMI Healthy Range: 18.5 kg/m2 - 25 kg/m2
BMI Categories
| Category | BMI Range |
|---|---|
| Underweight | < 18.5 |
| Normal weight | 18.5 – 24.9 |
| Overweight | 25 – 29.9 |
| Obesity | 30+ |
| View BMI Tables | |
Body Mass Index (BMI)
What is BMI?
BMI (Body Mass Index) is a simple numerical value that estimates whether a person’s weight is within a healthy range for their height. It is calculated by dividing body weight (in kilograms) by height (in meters squared). The result is expressed in units of kg/m², which come from mass in kilograms (kg) and height in metres (m). Because it uses only height and weight, BMI is a quick screening tool—not a measure of body fat, muscle mass, or overall health.
How a Body Mass Index (BMI) Calculator Works?
A BMI calculator uses a simple mathematical formula to estimate how your weight compares to a typical range for your height. You can choose between Metric units (kg, cm) or Standard/Imperial units (lb, ft/in). After entering your details, the calculator produces a BMI value and displays a scale showing the general weight category.
The scale will indicate similar 4 readings:

Underweight
Your BMI value is below the typical reference range for most adults. This may indicate lower body weight relative to height.
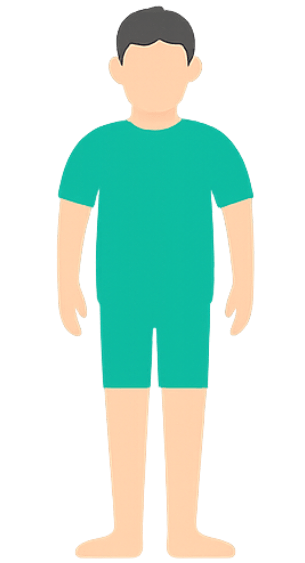
Healthy
Your BMI falls within the commonly used “normal” range. This suggests that your weight is generally in balance with your height.
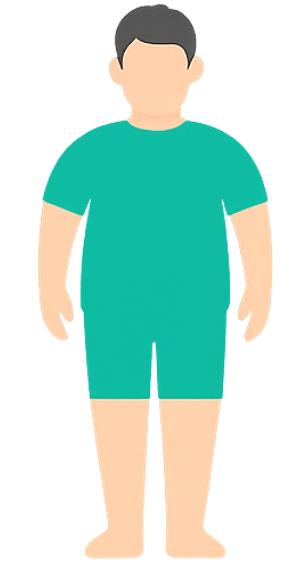
Overweight
Your BMI is above the typical reference range. This means your weight is higher relative to your height.
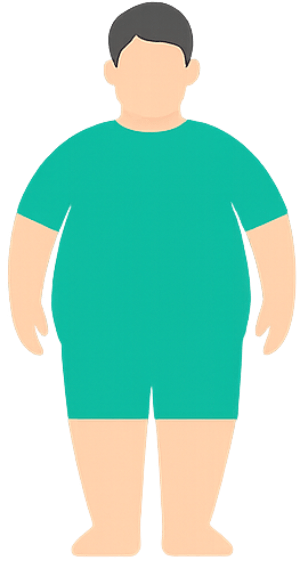
Obesity
Your BMI is well above the usual range used for adults. This classification indicates a significantly higher body-weight relative to height.
BMI calculations are the same for men and women, although results may vary slightly due to factors such as age, muscle mass, and body composition.
BMI Categories
Body Mass Index (BMI) is often used to describe how a person’s body weight compares to a general reference range for their height. While BMI can relate to body fat levels, it does not directly measure body fat, and factors such as muscle mass, body structure, and individual differences can influence the result.
For adults, the World Health Organization (WHO) groups BMI values into several broad categories. A BMI below 18.5 is considered underweight, while a value between 18.5 and 24.9 falls within the normal weight range. Measurements from 25.0 to 29.9 are classified as overweight, and a BMI of 30.0 or higher is placed in the obesity category. WHO also recognizes additional cut-off points, such as 16, 17, 18.5, 25, 30, 35, and 40, for more detailed statistical groupings. Some regions—particularly those studying Asian populations—use alternative thresholds such as 23, 27.5, 32.5, and 37.5 to reflect differences in body composition trends. These categories are statistical classifications, not diagnostic tools. They provide a general framework to interpret BMI values but do not account for age, muscle mass, or individual health differences.
BMI Table For Adults
| Category | BMI range (kg/m²) | Description |
|---|---|---|
| Underweight (Severe thinness) | < 16.0 | Very low BMI value compared to typical adult ranges. |
| Underweight (Moderate thinness) | 16.0 – 16.9 | Lower-than-average BMI for most adults. |
| Underweight (Mild thinness) | 17.0 – 18.4 | Slightly below the typical BMI range. |
| Normal range | 18.5 – 25.0 | Common BMI range for many adults. |
| Overweight (Pre-obese) | 25.0 – 30.0 | BMI above the average adult range. |
| Obese (Class I) | 30.0 – 35.0 | Higher BMI range within the obesity classification. |
| Obese (Class II) | 35.0 – 40.0 | Very high BMI range. |
| Obese (Class III) | ≥ 40.0 | Extremely high BMI value relative to height. |
BMI Chart For Adults

BMI For Children & Youth (Ages 2-20)
For individuals aged 2 to 20, BMI is interpreted differently than for adults. Although the calculation is the same, the result is compared to BMI-for-age percentiles for children of the same sex and age. Values below the 5th percentile are considered lower than typical for that age group, while values above the 95th percentile are higher than typical. Percentiles between the 85th and 95th indicate a higher-than-average range. These percentile classifications describe general growth patterns and are based on population statistics rather than fixed adult thresholds. The Centers for Disease Control and Prevention (CDC) recommends using BMI-for-age percentiles when evaluating growth in children and teens between ages 2 and 20.
Table:
| BMI Percentile | Classification |
|---|---|
| < 5th | Underweight |
| 5th – 84th | Normal Weight |
| 85th – 94th | Overweight |
| ≥ 95th | Obese |
CDC Growth Charts United States:
How BMI Is Calculated
BMI can be calculated in metric or US customary units. Both methods use the same basic idea—weight divided by height squared—but with slightly different equations depending on the measurement system.
BMI Formula

Metric (SI) Units
When weight is measured in kilograms and height in meters, the formula is:
BMI = weight (kg) ÷ [height (m)]²
If a person weighs 72 kg and is 175 cm tall:
- Convert height to meters: 175 cm = 1.75 m
- Apply the formula:
BMI = weight (kg) ÷ [height (m)]² - Calculation:
72 ÷ (1.75 × 1.75) - Result: BMI ≈ 23.5 kg/m²
This example shows the metric calculation used by the tool.
USC (Imperial) Units
When weight is measured in pounds and height in inches, BMI is calculated using a conversion factor:
BMI = 703 × weight (lb) ÷ [height (in)]²
If a person weighs 159 lb and is 5 ft 9 in tall:
- Convert height to inches: 5 ft 9 in = 69 in
- Apply the USC formula (uses conversion factor 703):
BMI = 703 × weight (lb) ÷ [height (in)]² - Calculation:
703 × 159 ÷ (69 × 69) - Result: BMI ≈ 23.5 kg/m²
The imperial formula yields the same BMI value once units are converted.
BMI Prime
BMI Prime is a simple way to express how a person’s BMI compares to the upper limit of the "normal" BMI range (which is 25). It is calculated by dividing the person’s BMI by 25:
BMI Prime = BMI ÷ 25
- If BMI Prime = 1 → BMI equals 25, the upper limit of the standard “normal” range.
- If BMI Prime < 1 → BMI is below 25, meaning it falls within or below the typical reference threshold.
- If BMI Prime > 1 → BMI is above 25, showing how far it extends beyond that benchmark.
BMI = 23.5 → BMI Prime = 23.5 / 25 = 0.94
Interpretation: 0.94 means the BMI is 94% of the 25 benchmark (below the 25 threshold).
BMI = 30 → BMI Prime = 30 / 25 = 1.20
Interpretation: 1.20 means the BMI is 20% above the 25 benchmark.
| Category | BMI (kg/m²) | BMI Prime |
|---|---|---|
| Underweight (Severe thinness) | < 16.0 | < 0.64 |
| Underweight (Moderate thinness) | 16.0 – 17.0 | 0.64 – 0.68 |
| Underweight (Mild thinness) | 17.0 – 18.5 | 0.68 – 0.74 |
| Normal range | 18.5 – 25.0 | 0.74 – 1.00 |
| Overweight (Pre-obese) | 25.0 – 30.0 | 1.00 – 1.20 |
| Obese (Class I) | 30.0 – 35.0 | 1.20 – 1.40 |
| Obese (Class II) | 35.0 – 40.0 | 1.40 – 1.60 |
| Obese (Class III) | ≥ 40.0 | ≥ 1.60 |
Limitations of BMI
BMI is a simple comparison of weight and height, but it does not directly measure body fat or reflect differences in body composition, growth, or individual characteristics. Because of this, BMI may not be a meaningful indicator for everyone, and its results should be interpreted with caution. Several groups may have BMI values that do not align well with their actual body makeup, and there are important factors that BMI cannot take into account.
Groups for whom BMI may not reflect body composition well
- Athletes or bodybuilders with higher muscle mass
- Children and teenagers who are still growing
- Individuals who are pregnant
- Adults over the age of 65
- People experiencing muscle loss or reduced muscle mass
Factors BMI does not account for
- Fat distribution: BMI cannot show where fat is stored—under the skin or deeper around internal areas—which can vary widely between individuals.
- Age-related changes: Body composition naturally shifts as people get older, even if BMI stays the same.
- Sex differences: At the same BMI, women typically have a higher percentage of body fat than men.
- Racial/ethnic variation: Body structure, muscle mass, and bone density can differ across population groups, influencing BMI values.
- Muscle mass: BMI cannot distinguish between weight from muscle and weight from fat, so muscular individuals may appear to have higher BMI values.
- Pregnancy: Body changes during pregnancy make BMI unsuitable for evaluating weight during this period.
Overall, BMI should be viewed as a broad statistical indicator rather than a detailed measure of personal health or body composition. It works best as a general screening measure, not a diagnostic tool.
Applications of BMI
BMI is widely used as a simple screening tool to compare weight relative to height. While it does not measure body fat or overall health, it provides a quick numerical value that can support population studies, growth monitoring, and general assessments. Its simplicity makes it useful in many non-diagnostic contexts where a basic weight-to-height comparison is needed.
Common applications of BMI
- General weight classification: BMI helps categorize weight ranges such as underweight, normal range, overweight, and obesity for adults.
- Public health and population studies: Researchers and organizations use BMI to track trends in body weight across large groups over time.
- Growth monitoring in children and teens: BMI-for-age percentiles are used to compare a child’s growth pattern with typical values for children of the same age and sex.
- Fitness and wellness programs: Some programs use BMI as one of several simple metrics when creating general wellness plans or progress summaries.
- Screening tool in routine checkups: BMI is sometimes referenced as part of a broader set of measurements to give an overview of weight relative to height.
- Baseline comparison across different groups: BMI provides a standardized way to compare weight–height ratios across populations, regions, or studies.
Disclaimer
This BMI Calculator and the information provided on this website are intended for general educational and informational purposes only. BMI is a simple screening measure and does not assess body fat, health status, or medical conditions. It should not be used as a substitute for professional medical advice, diagnosis, or treatment. If you have questions about your health, growth, or body composition, please consult a qualified healthcare professional.
References & Resources
- Nutrition and Healthy Eating
- Healthy Weight
- Why people become overweight
- Obesity and overweight
- Managing your weight
- Losing Weight
- Eating Disorders
-
World Health Organization (WHO)
Global guidance and information on BMI, obesity, and population-level data. (WHO fact sheets)
-
CDC Growth Charts
Includes BMI-for-age growth charts and guidance for children and adolescents.
-
NHS (UK)
User-friendly explanation of Obesity, causes, diagnosis, and treatment.
-
NIH / NHLBI
Resources on weight, risk factors, and public-health guidance.
-
Cleveland Clinic
Patient-focused overview: how BMI is used, examples, and limitations.
-
American Heart Association (AHA)
Context on BMI, heart health, and lifestyle recommendations.
-
American Academy of Pediatrics (AAP)
Pediatric guidance and considerations for growth monitoring.
-
RCPCH growth charts references
Growth references and percentile charts used for children worldwide.
-
U.S. Department of Health & Human Services (HHS)
Useful national-level resources and links to clinical guidance.